

We're for all- ALL are for us for the greater interest of Humanism-Truth-Facts-Friendship-Unity-Participation including Physico-Mental Sound Health with Spirituality enrichment through ''TOTAL HEALTH SOLUTION'' to a Well-furnished GOALofTruth alloted for all in real sense ;
From wikipedia & other reliable sources ( Poets, Writers, Thinkers, Researchers, Free Lancers, Philosophers, Theologists, Scientists, Orators, Sociologists and Photographers +Artists-Musicians & etc.) we can learn as follows :
 HUMAN Population
''In demographics, the world population is the total number of humans currently living. It was estimated by the United Nations to have exceeded 8 billion in November 2022. It took over 200,000 years of human prehistory and history for the human population to reach one billion and only 219 years more to reach 8 billion.[3]
The human population experienced continuous growth following the Great Famine of 1315–1317 and the end of the Black Death in 1350, when it was nearly 370,000,000.[4] The highest global population growth rates, with increases of over 1.8% per year, occurred between 1955 and 1975, peaking at 2.1% between 1965 and 1970.[5] The growth rate declined to 1.1% between 2015 and 2020 and is projected to decline further in the 21st century.[6][7] The global population is still increasing, but there is significant uncertainty about its long-term trajectory due to changing fertility and mortality rates.[8] The UN Department of Economics and Social Affairs projects between 9 and 10 billion people by 2050 and gives an 80% confidence interval of 10–12 billion by the end of the 21st century,[2] with a growth rate by then of zero.[7] Other demographers predict that the human population will begin to decline in the second half of the 21st century.[9]
The total number of births globally is currently (2015–2020) 140 million/year, which is projected to peak during the period 2040–2045 at 141 million/year and then decline slowly to 126 million/year by 2100.[10] The total number of deaths is currently 57 million/year and is projected to grow steadily to 121 million/year by 2100.[11]
The median age of human beings as of 2020 is 31 years''.[12]
Global population Chart : Population size fluctuates at differing rates in differing regions. Nonetheless, population growth has been the long-standing trend on all inhabited continents, as well as in most individual states. During the 20th century, the global population saw its greatest increase in known history, rising from about 1.6 billion in 1900 to over 6 billion in 2000[105] as the whole world entered the early phases of what has come to be called the "demographic transition". Some of the key factors contributing to this increase included the lessening of the mortality rate in many countries by improved sanitation and medical advances, and a massive increase in agricultural productivity attributed to the Green Revolution.[106][107] By 2000, there were approximately ten times as many people on Earth as there had been in 1700.
However, this rapid growth did not last. During the period 2000–2005, the United Nations estimates that the world's population was growing at an annual rate of 1.3% (equivalent to around 80 million people), down from a peak of 2.1% during the period 1965–1970.[6] Globally, although the population growth rate has been steadily declining from its peak in 1968,[108] growth still remains high in Sub-Saharan Africa.[109]

_001.jpg)
In fact, during the 2010s, Japan and some countries in Europe began to encounter negative population growth (i.e. a net decrease in population over time), due to sub-replacement fertility rates.[104]
In 2019, the United Nations reported that the rate of population growth continues to decline due to the ongoing global demographic transition. If this trend continues, the rate of growth may diminish to zero by 2100, concurrent with a world population plateau of 10.9 billion.[6][69] However, this is only one of many estimates published by the UN; in 2009, UN population projections for 2050 ranged between around 8 billion and 10.5 billion.[110] An alternative scenario is given by the statistician Jorgen Randers, who argues that traditional projections insufficiently take into account the downward impact of global urbanization on fertility. Randers' "most likely scenario" reveals a peak in the world population in the early 2040s at about 8.1 billion people, followed by decline.[111] Adrian Raftery, a University of Washington professor of statistics and of sociology, states that "there's a 70 percent probability the world population will not stabilize this century. Population, which had sort of fallen off the world's agenda, remains a very important issue."[112]
-
Estimated world population figures, 10,000 BC–AD 2000
-
Estimated world population figures, 10,000 BC–AD 2000 (in log y scale)
-
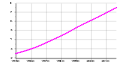 World population figures, 1950–2017

Annual population growth
| Year | Population | Yearly growth | Density (pop/km2) |
Urban population | ||
|---|---|---|---|---|---|---|
| % | Number | Number | % | |||
| 1951 | 2,584,034,261 | 1.88% | 47,603,112 | 17 | 775,067,697 | 30% |
| 1952 | 2,630,861,562 | 1.81% | 46,827,301 | 18 | 799,282,533 | 30% |
| 1953 | 2,677,608,960 | 1.78% | 46,747,398 | 18 | 824,289,989 | 31% |
| 1954 | 2,724,846,741 | 1.76% | 47,237,781 | 18 | 850,179,106 | 31% |
| 1955 | 2,773,019,936 | 1.77% | 48,173,195 | 19 | 877,008,842 | 32% |
| 1956 | 2,822,443,282 | 1.78% | 49,423,346 | 19 | 904,685,164 | 32% |
| 1957 | 2,873,306,090 | 1.80% | 50,862,808 | 19 | 933,113,168 | 32% |
| 1958 | 2,925,686,705 | 1.82% | 52,380,615 | 20 | 962,537,113 | 33% |
| 1959 | 2,979,576,185 | 1.84% | 53,889,480 | 20 | 992,820,546 | 33% |
| 1960 | 3,034,949,748 | 1.86% | 55,373,563 | 20 | 1,023,845,517 | 34% |
| 1961 | 3,091,843,507 | 1.87% | 56,893,759 | 21 | 1,055,435,648 | 34% |
| 1962 | 3,150,420,795 | 1.89% | 58,577,288 | 21 | 1,088,376,703 | 35% |
| 1963 | 3,211,001,009 | 1.92% | 60,580,214 | 22 | 1,122,561,940 | 35% |
| 1964 | 3,273,978,338 | 1.96% | 62,977,329 | 22 | 1,157,813,355 | 35% |
| 1965 | 3,339,583,597 | 2.00% | 65,605,259 | 22 | 1,188,469,224 | 36% |
| 1966 | 3,407,922,630 | 2.05% | 68,339,033 | 23 | 1,219,993,032 | 36% |
| 1967 | 3,478,769,962 | 2.08% | 70,847,332 | 23 | 1,252,566,565 | 36% |
| 1968 | 3,551,599,127 | 2.09% | 72,829,165 | 24 | 1,285,933,432 | 36% |
| 1969 | 3,625,680,627 | 2.09% | 74,081,500 | 24 | 1,319,833,474 | 36% |
| 1970 | 3,700,437,046 | 2.06% | 74,756,419 | 25 | 1,354,215,496 | 37% |
| 1971 | 3,775,759,617 | 2.04% | 75,322,571 | 25 | 1,388,834,099 | 37% |
| 1972 | 3,851,650,245 | 2.01% | 75,890,628 | 26 | 1,424,734,781 | 37% |
| 1973 | 3,927,780,238 | 1.98% | 76,129,993 | 26 | 1,462,178,370 | 37% |
| 1974 | 4,003,794,172 | 1.94% | 76,013,934 | 27 | 1,501,134,655 | 37% |
| 1975 | 4,079,480,606 | 1.89% | 75,686,434 | 27 | 1,538,624,994 | 38% |
| 1976 | 4,154,666,864 | 1.84% | 75,186,258 | 28 | 1,577,376,141 | 38% |
| 1977 | 4,229,506,060 | 1.80% | 74,839,196 | 28 | 1,616,419,308 | 38% |
| 1978 | 4,304,533,501 | 1.77% | 75,027,441 | 29 | 1,659,306,117 | 39% |
| 1979 | 4,380,506,100 | 1.76% | 75,972,599 | 29 | 1,706,021,638 | 39% |
| 1980 | 4,458,003,514 | 1.77% | 77,497,414 | 30 | 1,754,201,029 | 39% |
| 1981 | 4,536,996,762 | 1.77% | 78,993,248 | 30 | 1,804,215,203 | 40% |
| 1982 | 4,617,386,542 | 1.77% | 80,389,780 | 31 | 1,854,134,229 | 40% |
| 1983 | 4,699,569,304 | 1.78% | 82,182,762 | 32 | 1,903,822,436 | 41% |
| 1984 | 4,784,011,621 | 1.80% | 84,442,317 | 32 | 1,955,106,433 | 41% |
| 1985 | 4,870,921,740 | 1.82% | 86,910,119 | 33 | 2,007,939,063 | 41% |
| 1986 | 4,960,567,912 | 1.84% | 89,646,172 | 33 | 2,062,604,394 | 42% |
| 1987 | 5,052,522,147 | 1.85% | 91,954,235 | 34 | 2,118,882,551 | 42% |
| 1988 | 5,145,426,008 | 1.84% | 92,903,861 | 35 | 2,176,126,537 | 42% |
| 1989 | 5,237,441,558 | 1.79% | 92,015,550 | 35 | 2,233,140,502 | 43% |
| 1990 | 5,327,231,061 | 1.71% | 89,789,503 | 36 | 2,290,228,096 | 43% |
| 1991 | 5,414,289,444 | 1.63% | 87,058,383 | 36 | 2,347,462,336 | 43% |
| 1992 | 5,498,919,809 | 1.56% | 84,630,365 | 37 | 2,404,337,297 | 44% |
| 1993 | 5,581,597,546 | 1.50% | 82,677,737 | 37 | 2,461,223,528 | 44% |
| 1994 | 5,663,150,427 | 1.46% | 81,552,881 | 38 | 2,518,254,111 | 44% |
| 1995 | 5,744,212,979 | 1.43% | 81,062,552 | 39 | 2,575,505,235 | 45% |
| 1996 | 5,824,891,951 | 1.40% | 80,678,972 | 39 | 2,632,941,583 | 45% |
| 1997 | 5,905,045,788 | 1.38% | 80,153,837 | 40 | 2,690,813,541 | 46% |
| 1998 | 5,984,793,942 | 1.35% | 79,748,154 | 40 | 2,749,213,598 | 46% |
| 1999 | 6,064,239,055 | 1.33% | 79,445,113 | 41 | 2,808,231,655 | 46% |
| 2000 | 6,143,494,000 | 1.31% | 79,255,000 | 41 | 2,868,308,000 | 46% |
| 2001 | 6,222,627,000 | 1.29% | 79,133,000 | 42 | 2,933,079,000 | 47% |
| 2002 | 6,301,773,000 | 1.27% | 79,147,000 | 42 | 3,001,808,000 | 47% |
| 2003 | 6,381,185,000 | 1.26% | 79,412,000 | 43 | 3,071,744,000 | 48% |
| 2004 | 6,461,159,000 | 1.25% | 79,974,000 | 43 | 3,143,045,000 | 48% |
| 2005 | 6,541,907,000 | 1.25% | 80,748,000 | 44 | 3,215,906,000 | 49% |
| 2006 | 6,623,518,000 | 1.25% | 81,611,000 | 44 | 3,289,446,000 | 50% |
| 2007 | 6,705,947,000 | 1.24% | 82,429,000 | 45 | 3,363,610,000 | 50% |
| 2008 | 6,789,089,000 | 1.24% | 83,142,000 | 46 | 3,439,719,000 | 50% |
| 2009 | 6,872,767,000 | 1.23% | 83,678,000 | 47 | 3,516,830,000 | 51% |
| 2010 | 6,956,824,000 | 1.22% | 84,057,000 | 47 | 3,594,868,000 | 51% |
| 2011 | 7,041,194,000 | 1.21% | 84,371,000 | 47 | 3,671,424,000 | 52% |
| 2012 | 7,125,828,000 | 1.20% | 84,634,000 | 48 | 3,747,843,000 | 52% |
| 2013 | 7,210,582,000 | 1.19% | 84,754,000 | 48 | 3,824,990,000 | 53% |
| 2014 | 7,295,291,000 | 1.17% | 84,709,000 | 49 | 3,902,832,000 | 53% |
| 2015 | 7,379,797,000 | 1.16% | 84,506,000 | 50 | 3,981,498,000 | 54% |
| 2016 | 7,464,022,000 | 1.14% | 84,225,000 | 50 | 4,060,653,000 | 54% |
| 2017 | 7,547,859,000 | 1.12% | 83,837,000 | 51 | 4,140,189,000 | 55% |
| 2018 | 7,631,091,000 | 1.10% | 83,232,000 | 51 | 4,219,817,000 | 55% |
| 2019 | 7,713,468,000 | 1.08% | 82,377,000 | 52 | 4,299,439,000 | 56% |
| 2020 | 7,795,000,000 | 1.05% | 81,331,000 | 52 | 4,378,900,000 | 56% |
Population growth by region
| Region | 1500 | 1600 | 1700 | 1750 | 1800 | 1850 | 1900 | 1950 | 1999 | 2008 | 2010 | 2012 | 2050 | 2150 |
|---|---|---|---|---|---|---|---|---|---|---|---|---|---|---|
| World | 585 | 660 | 710 | 791 | 978 | 1,262 | 1,650 | 2,521 | 6,008 | 6,707 | 6,896 | 7,052 | 9,725 | 9,746 |
| Africa | 86 | 114 | 106 | 106 | 107 | 111 | 133 | 221 | 783 | 973 | 1,022 | 1,052 | 2,478 | 2,308 |
| Asia | 282 | 350 | 411 | 502 | 635 | 809 | 947 | 1,402 | 3,700 | 4,054 | 4,164 | 4,250 | 5,267 | 5,561 |
| Europe | 168 | 170 | 178 | 190 | 203 | 276 | 408 | 547 | 675 | 732 | 738 | 740 | 734 | 517 |
| Latin America[Note 1] | 40 | 20 | 10 | 16 | 24 | 38 | 74 | 167 | 508 | 577 | 590 | 603 | 784 | 912 |
| Northern America[Note 1] | 6 | 3 | 2 | 2 | 7 | 26 | 82 | 172 | 312 | 337 | 345 | 351 | 433 | 398 |
| Oceania | 3 | 3 | 3 | 2 | 2 | 2 | 6 | 13 | 30 | 34 | 37 | 38 | 57 | 51 |
| Region | 1500 | 1600 | 1700 | 1750 | 1800 | 1850 | 1900 | 1950 | 1999 | 2008 | 2010 | 2012 | 2050 | 2150 |
|---|---|---|---|---|---|---|---|---|---|---|---|---|---|---|
| Africa | 14.7 | 17.3 | 14.9 | 13.4 | 10.9 | 8.8 | 8.1 | 8.8 | 13.0 | 14.5 | 14.8 | 15.2 | 25.5 | 23.7 |
| Asia | 48.2 | 53.0 | 57.9 | 63.5 | 64.9 | 64.1 | 57.4 | 55.6 | 61.6 | 60.4 | 60.4 | 60.3 | 54.2 | 57.1 |
| Europe | 28.7 | 25.8 | 25.1 | 20.6 | 20.8 | 21.9 | 24.7 | 21.7 | 11.2 | 10.9 | 10.7 | 10.5 | 7.6 | 5.3 |
| Latin America[Note 1] | 6.8 | 3.0 | 1.4 | 2.0 | 2.5 | 3.0 | 4.5 | 6.6 | 8.5 | 8.6 | 8.6 | 8.6 | 8.1 | 9.4 |
| Northern America[Note 1] | 1.0 | 0.5 | 0.3 | 0.3 | 0.7 | 2.1 | 5.0 | 6.8 | 5.2 | 5.0 | 5.0 | 5.0 | 4.5 | 4.1 |
| Oceania | 0.5 | 0.5 | 0.4 | 0.3 | 0.2 | 0.2 | 0.4 | 0.5 | 0.5 | 0.5 | 0.5 | 0.5 | 0.6 | 0.5 |
Past population: Estimates of historical world population
The following table gives estimates, in millions, of population in the past. The data for 1750 to 1900 are from the UN report "The World at Six Billion"[120] whereas the data from 1950 to 2015 are from a UN data sheet.[89]
| Year | World | Africa | Asia | Europe | Latin America & Carib.[Note 1] |
North America [Note 1] |
Oceania | Notes |
|---|---|---|---|---|---|---|---|---|
| 70,000 BC | < 0.015 | 0 | 0 | [121] | ||||
| 10,000 BC | 4 | [122] | ||||||
| 8000 BC | 5 | |||||||
| 6500 BC | 5 | |||||||
| 5000 BC | 5 | |||||||
| 4000 BC | 7 | |||||||
| 3000 BC | 14 | |||||||
| 2000 BC | 27 | |||||||
| 1000 BC | 50 | 7 | 33 | 9 | [citation needed] | |||
| 500 BC | 100 | 14 | 66 | 16 | ||||
| AD 1 | 200 | 23 | 141 | 28 | ||||
| 1000 | 400 | 70 | 269 | 50 | 8 | 1 | 2 | |
| 1500 | 458 | 86 | 243 | 84 | 39 | 3 | 3 | |
| 1600 | 580 | 114 | 339 | 111 | 10 | 3 | 3 | |
| 1700 | 682 | 106 | 436 | 125 | 10 | 2 | 3 | |
| 1750 | 791 | 106 | 502 | 163 | 16 | 2 | 2 | |
| 1800 | 1,000 | 107 | 656 | 203 | 24 | 7 | 3 | |
| 1850 | 1,262 | 111 | 809 | 276 | 38 | 26 | 2 | |
| 1900 | 1,650 | 133 | 947 | 408 | 74 | 82 | 6 | |
| 1950 | 2,525 | 229 | 1,394 | 549 | 169 | 172 | 12.7 | [123] |
| 1955 | 2,758 | 254 | 1,534 | 577 | 193 | 187 | 14.2 | |
| 1960 | 3,018 | 285 | 1,687 | 606 | 221 | 204 | 15.8 | |
| 1965 | 3,322 | 322 | 1,875 | 635 | 254 | 219 | 17.5 | |
| 1970 | 3,682 | 366 | 2,120 | 657 | 288 | 231 | 19.7 | |
| 1975 | 4,061 | 416 | 2,378 | 677 | 326 | 242 | 21.5 | |
| 1980 | 4,440 | 478 | 2,626 | 694 | 365 | 254 | 23.0 | |
| 1985 | 4,853 | 550 | 2,897 | 708 | 406 | 267 | 24.9 | |
| 1990 | 5,310 | 632 | 3,202 | 721 | 447 | 281 | 27.0 | |
| 1995 | 5,735 | 720 | 3,475 | 728 | 487 | 296 | 29.1 | |
| 2000 | 6,127 | 814 | 3,714 | 726 | 527 | 314 | 31.1 | |
| 2005 | 6,520 | 920 | 3,945 | 729 | 564 | 329 | 33.4 | |
| 2010 | 6,930 | 1,044 | 4,170 | 735 | 600 | 344 | 36.4 | |
| 2015 | 7,349 | 1,186 | 4,393 | 738 | 634 | 358 | 39.3 |
Using the above figures, the change in population from 2010 to 2015 was:
- World: +420 million
- Africa: +142 million
- Asia: +223 million
- Europe: +3 million
- Latin America and Caribbean: +35 million
- Northern America: +14 million
- Oceania: +2.9 million
- ^ Jump up to:a b c d e f North America is here defined to include the northernmost countries and territories of North America: Canada, the United States, Greenland, Bermuda, and Saint Pierre and Miquelon. Latin America & Carib. comprises Mexico, Central America, the Caribbean, and South America''
We're for all- ALL are for us for the greater interest of Humanism-Truth-Facts-Friendship-Unity-Participation to a Well-furnished GOAL of Truth from which all shall have ++++;
We're indebted to WIKIPEDIA +WHO for a short while and as 'Guardian QUOTATION' from Global WISER ONE. And have quoted many images, article's, writings etc. by great & humanist writers+++ from global thinkers, Well-wishers, Wiseman, Humanists and Others Living-Nonlivings in favor of HUMANISM to share more answers of Researchers-readers+++++....
To reach the 'GOAL of FULFILNESS' unitedly to alive in the "DESTINATION of TRUTH-FACTS-CHARMEST AMICABLITY" of Natural Joyful POSSIBILITIES+++
BREAST CANCER, TUMOR, Arsenic+Chemical Poisoning, Corona, Heart-Lung diseases, Neurological-Hormonal-Immunal-Infectious diseases with related complexities are possible to cure properly-easily-scientifically-accurately (100%) by our positive medical services only with+++++balance confirming
Medicine-Food control-proper nursing-medicinal massage-Medicinal Yogas- Meditation, Physiotherapy special etc. without side effects & Repeatation as per contract through user-friendly approved ways of CURE++++. please fill our form as below or click:
After confirming contract-letter between you+++. We serve you properly with no Chemo-therapy-radiation therapy -SURGICAL Complexities (Physical-Mental) to CURE+++ upto our Limit to recover your both-health from illness.